using_statistics
Table of Contents
KeexyBox - Display Internet usage statistics
You can view statistics of the domain / websites visited by users or devices. Statistics are only made for users and devices who use a profile with the statistics option enabled.
View statistics:
- Use your browser and connect to the KeexyBox Management Web interface.
- On left menu, click on
Statistics. - You will be redirected to a form that allows you to filter the statistics.
Filter form
A form allows you to filter the statistics data.
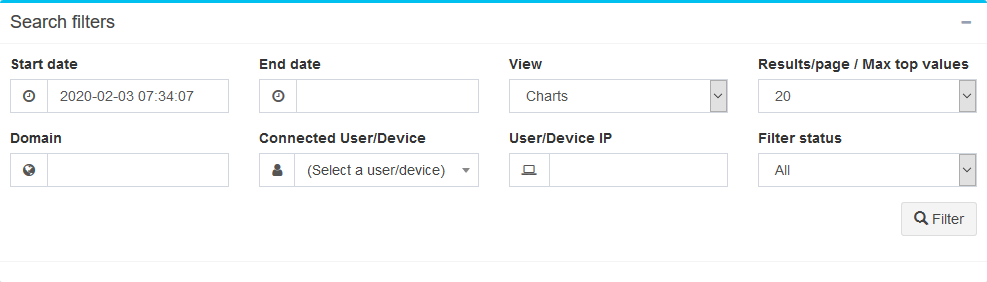
Below the table describing each filter:
| Filter | Description |
|---|---|
| Start date | Filter from given date and time. |
| End date | Filter up to given date and time. |
| View | Charts displays pies and graphs. |
| Log displays logs of queried domains. | |
| Most queried domains displays the domains from the most visited to the least visited. | |
| Most active users and devices displays the most active to least active IP addresses of users or devices. | |
| Results/page / Max top values | Define the max result per page or the top values if charts view were selected. |
| Domain | Filter by domain/website or part of a domain name. |
| Connected User/Device | Pick up a connected user or device to complete User/Device IP field. |
| User/Device IP | Filter by a user or device IP address |
| Filter status | Filter by blocked or accepted website/domains. |
Views
Charts
By using the Charts view, you will see bar and pie charts.
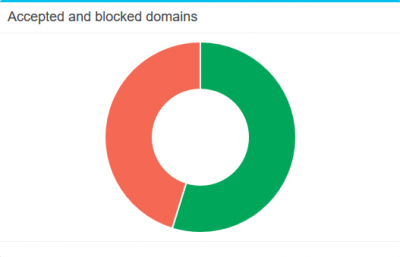
The pie chart below can shows you the part of blocked domains (red) and accepted domains (green) and the bar chart show you them by time slot.
 |  |
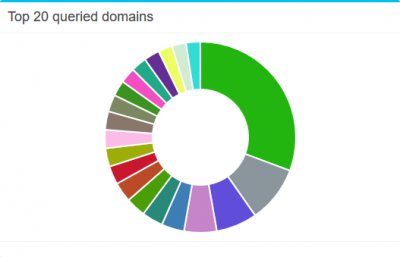
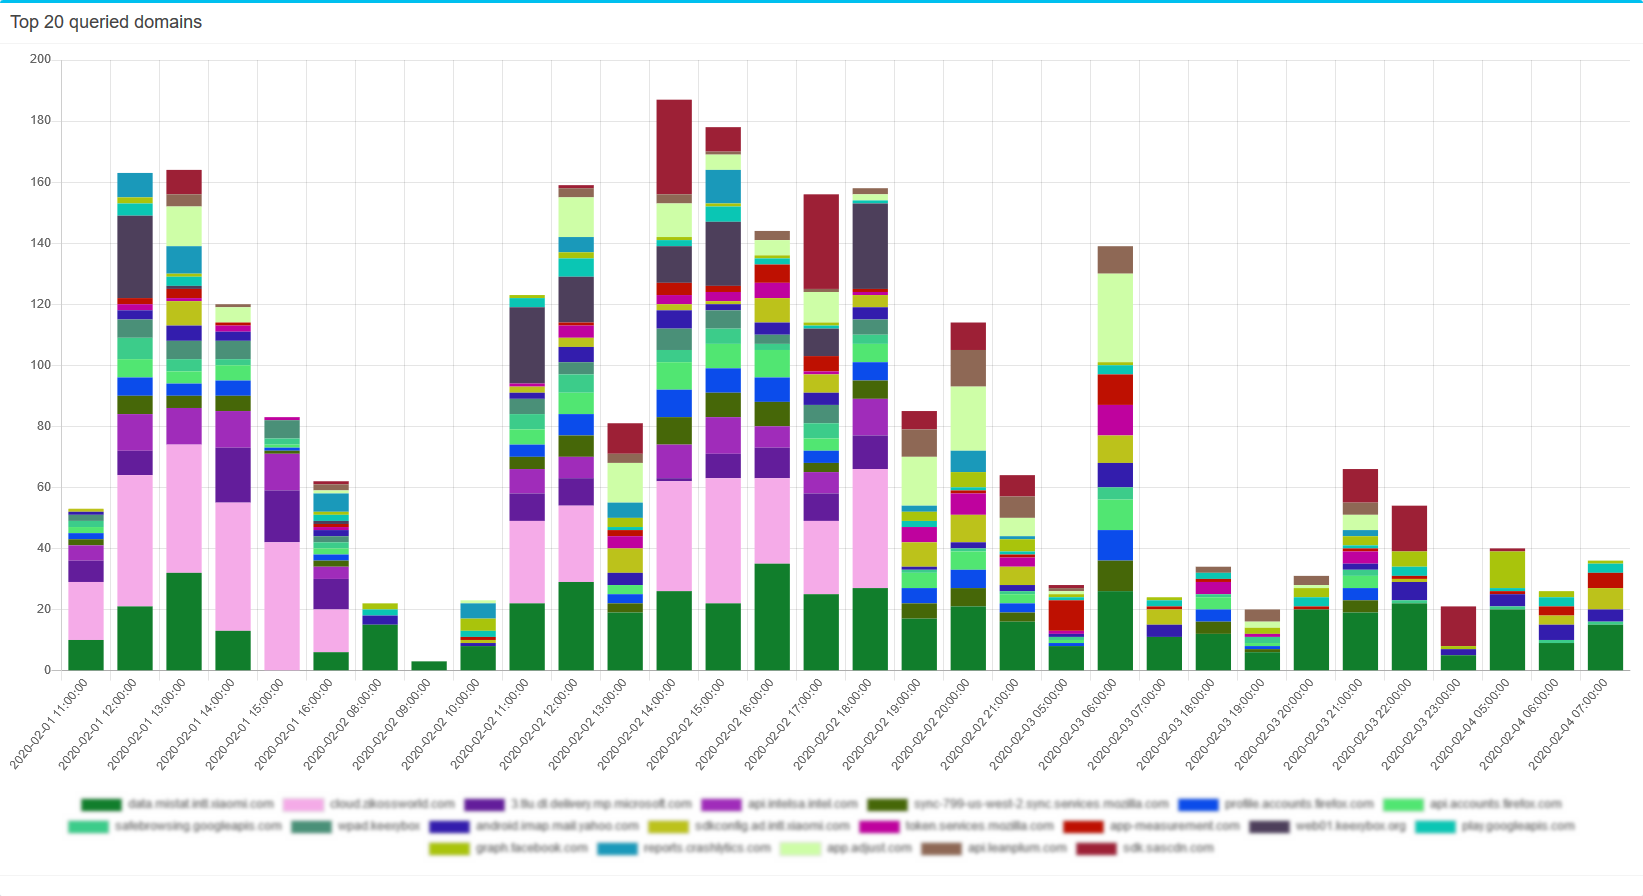
The pie chart below can shows you the most visited domains and the bar chart show you them by time slot.
 |  |
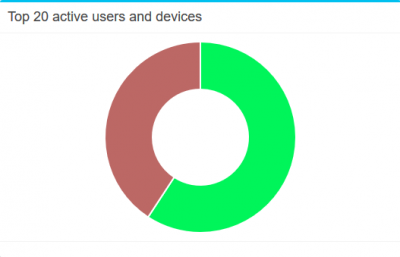
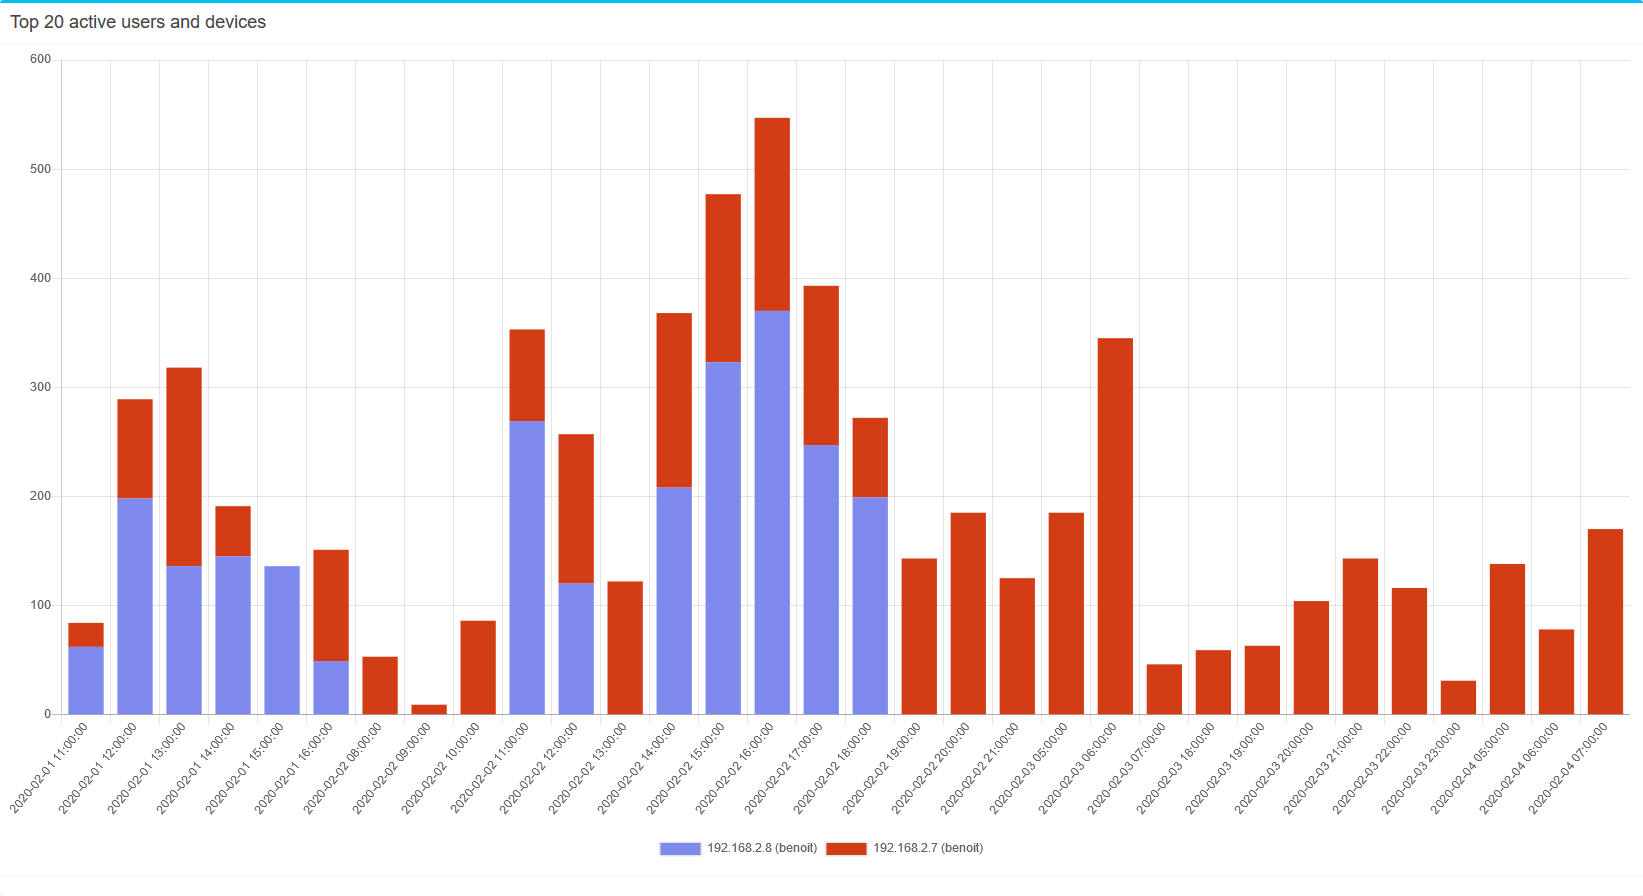
The pie chart below can shows you the most active IP addresses and the bar chart show you them by time slot.
 |  |
About KeexyBox Project:
using_statistics.txt · Last modified: 2020/09/25 09:42 by paul